
|
International Futures Research |
There is a huge battle going on between the apparently bullish short term price move in Corn vs. the internal characteristics of the rally. There is no denying that price moved up during the first four days of the most recent trading week. But it was due to short covering.
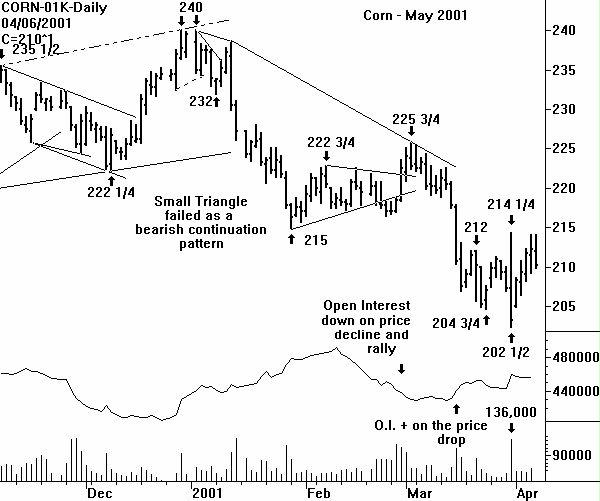
The 4 cent price drop on Friday March 30 took place on expanding open interest. This is bearish. The ensuing four day price rally took place on declining open interest. This is bearish.
Before discussing the possible outcome, a note on trading strategy. CHARTWATCH was bearish on the May corn because of the small Head & Shoulders Top on the weekly continuation chart. Shorting a rally in the May Corn at 204 1/4 produced a loss when the next resistance level at 207 was violated to the upside. The protective buy-stop was placed correctly; It did its job. The risk : reward of a short sale was correct.
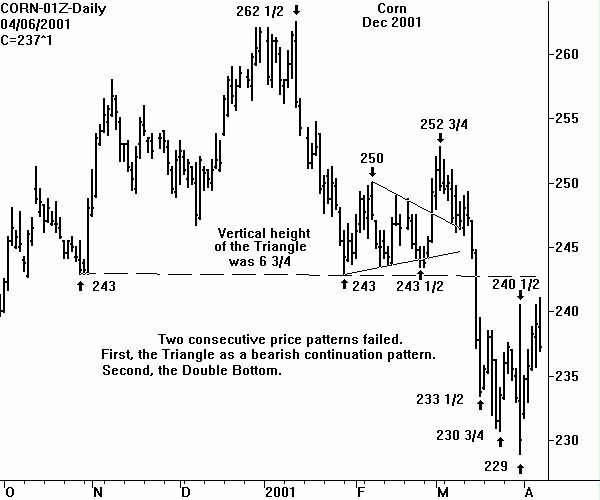
Now that the H&S Top on the weekly continuation chart (click below) is in jeopardy, what is a technical trader to do? CHARTWATCH must now conclude that the large Outside Range Week was stronger than the H&S Top on the weekly chart. This is not usually the case. In theory, the 214 1/4 weekly high on the May Corn is the upside price target. Given two (unsuccessful) attempts to better 214 1/4 and then Friday's two cent lower close, the close proximity of classical overhead resistance must be coming into play.
The resistance is the 215 price low on January 29 on the May Corn This price level is very evident on a weekly chart of the May Corn only (not shown). CHARTWATCH figures that 215 on the May Corn is now the most important price to watch. If May Corn is able to close and stay above 215 for two or more trading sessions, the weight of the technical evidence will be moving to the bull camp. The inability of the May Corn to close or stay above 215 means the price pressure will continue.
Use 215 as the pivotal price point for technical trading decisions.
Weekly and Monthly Corn Charts
Implied Volatility Charts (Thru Feb 5, 2001)
Seasonal Volume and Open Interest and Commitments Graphs
Return to Sample Research Reports
| Home | Weekly Research Reports | Audio Market Update | Technical Analysis Video Tapes | Technical Analysis Books | Technical Analysis Courses |