
|
International Futures Research |
In trying to determine just how strong the price rally in the Eurodollars really is, CHARTWATCH suggested dissecting the volume and open interest statistics associated with the Friday March 30 price rally of 7 basis points.
CHARTWATCH was surprised at the bullish magnitude of the internal statistics for March 30. Volume was definitely not low (below 600,000). The actual figure was 788,764 total contracts. And open interest was up a huge 63,109 contracts. So much for the right shoulder (of an H&S Top) technical thought.
What next? Again technically orientated traders have the ability to analyze the volume and open interest associated with a bullish price move on a Friday. Once very week, the statistics are available before any trading (electronic or pit) begins the next trading session. This is because the CME runs it's clearing cycle on Saturday (unlike the CBOT).
Because every reader of the Eurodollar Research reports is a professional, CHARTWATCH is reluctant to repeat the obvious - but here it goes. High volume (800,000+) and open interest increasing more than 3,000 contracts would be bullish.
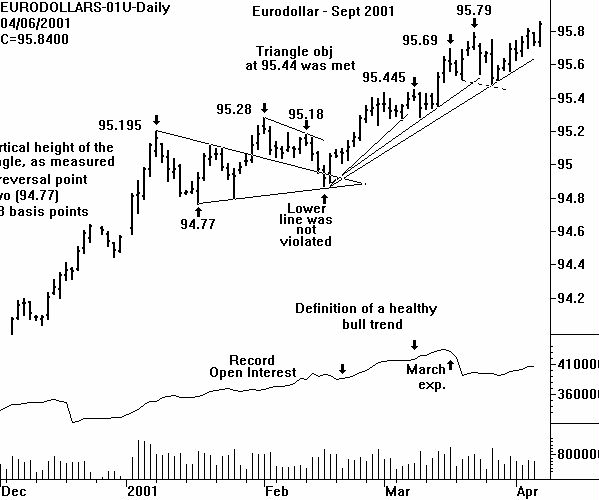
If this is true, any price dip to underlying support at the former price high of 95.79 on the Sept 2001 future must be considered a buying opportunity.
Until the support is broken and the series of higher and higher price lows continues - the price bull, yield bear is in control.
Eurodollar Monthly Chart
Example of the difference between a
weekly chart of a single
contract month
and a weekly continuation chart using the nearest-to-expire future.
(This is a mini case study!)
Return to Sample Research Reports
| Home | Weekly Research Reports | Audio Market Update | Technical Analysis Video Tapes | Technical Analysis Books | Technical Analysis Courses |