|
International Futures Research |
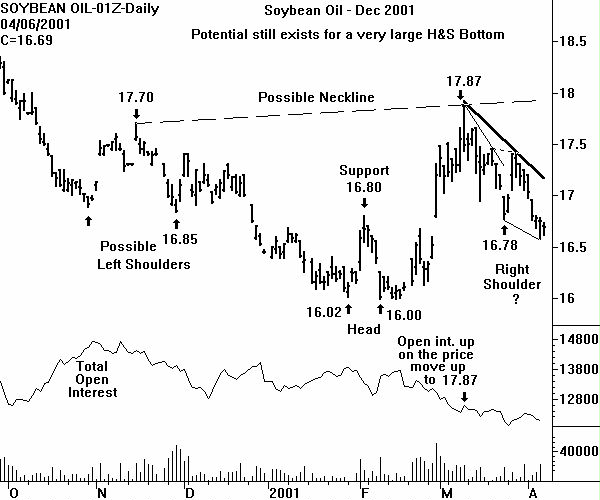
Over the last few months the bar charts in the Soybean complex have done their best to shake a chartist's confidence in the reliability of the Head & Shoulders Bottom pattern. But CHARTWATCH must state that the possibility of an H&S Bottom on the Dec Bean Oil chart discussed last week was only that - a possibility. Therefore CHARTWATCH cannot complain about the small loss in long positions in Dec Oil trying to lead' off on the potential for the H&S Bottom. The problem was that of not being disciplined - and waiting for the pattern to be activated with a high volume close above the neckline.
What next? Note that the larger possible neckline of a Head & Shoulders Bottom is still present on the Dec Bean Oil chart. But it would take a close above 17.90 to officially activate this pattern. A bar chartist will first key on the two point downsloping trendline that starts at the 17.87 high (March 9). A close above this line would activate a bullish Falling Wedge. The minimum upside measuring objective would be to trade above 17.87. This line crosses at a price level of 17.12 on Monday April 9.
If an upside breakout occurs, a return to the long side of the Dec Oil is suggested. A money management protective sell-stop of 50 points would be used.
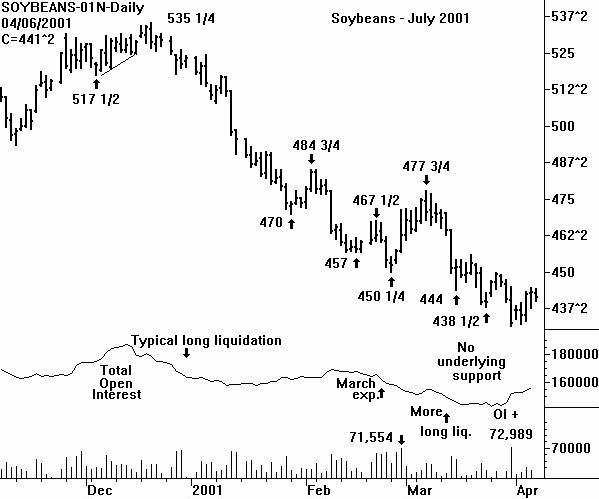
If the Soybean Oil does start moving up in price, what will this do to the look' of the charts of the Soybeans? CHARTWATCH figures that the November Soybeans would have to be trading above the closest resistance at 439. Indeed, as the trading week was ending, the Nov Beans were testing' this resistance. But Friday's close of 436 3/4 was obviously below the resistance.
The internal characteristics of the 8 1/4 cent price drop in Soybeans (July) on Friday March 30 need to be examined. Volume was very high at 72,989. The volume was so high that it could be construed as blowoff volume. And price has rallied. But the open interest change at a positive 6,256 contracts was a definite bearish indicator. This means the price bounce could only be that - a bounce. This is why it is so important to be aware of the location of overhead resistance.
The July Beans have consistently entered overhead resistance (after a price fall into new low ground). But these entries into overhead resistance have failed to produce a new rally high. This is the definition of a bear market.
CHARTWATCH is still very intrigued with the 9-week RSI on the weekly continuation chart of the Soybeans (click below). The most recent relative low reading of 25.88 (as of March 30) means that a failure swing is present with respect to the 18.59 reading associated with the higher price low on August 4, 2000. Ideally, the most recent low reading would have been below 25.00, in oversold territory.
Obviously, if the Soybeans rally in price, the look' of the price chart vs. the 9-week RSI plot will be classic. A divergence between the two charts will exist and a failure swing will be present on the RSI plot.
CHARTWATCH will use the Friday April 6 close in relation to the closest overhead resistance to come to a trading conclusion. The resistance held. So more patience for the bulls is needed.
Soybean Complex Weekly and Monthly Charts
Note: Monthly charts updated only once a month
Selected Implied Volatility Charts (Thru March 6, 2001)
Seasonal Volume and Open Interest and Commitments Graphs
Return to Sample Research Reports
| Home | Weekly Research Reports | Audio Market Update | Technical Analysis Video Tapes | Technical Analysis Books | Technical Analysis Courses |