
|
International Futures Research |
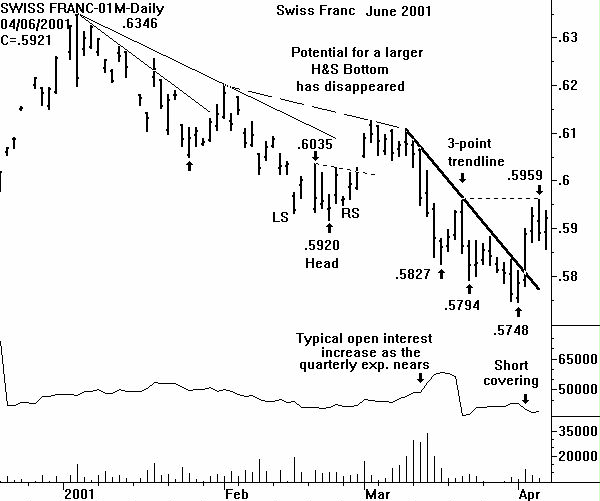
The Outside Range Day on Friday March 30 failed. A lower price low (than Friday's .5750) was posted (by two tics) on Monday April 30. Having stated this, a more important technical event also discussed last week did occur on the daily June Swiss Franc chart. The important three point downsloping trendline was violated with a close above it.
Before becoming too bullish, the trendline break only changed the near-term price downtrend to neutral. But CHARTWATCH did suggest initiating new longs based on this event and the bullish potential of the long term chart.
Disappointing to the bull case was the fact that the 104 point price rally on April 3 (thru the trendline) was due to net short covering. Total open interest dropped 3,328 contracts. This means that potential bullish traders should not have to chase the current rally.
Indeed, a price decline on declining volume would make the daily chart look more bullish. This could form the right shoulder of a Head & Shoulders Bottom. This selloff began on Friday with the lower daily price low, even though the close was 33 points higher.
Ideally, a purchase of the June Swiss can be made on a price break to .5836. This would be just above support on the chart and add symmetry to the H&S Bottom possibility. A protective sell-stop of 60 points would be used.
Monthly Swiss Franc Chart
Return to Sample Research Reports
| Home | Weekly Research Reports | Audio Market Update | Technical Analysis Video Tapes | Technical Analysis Books | Technical Analysis Courses |