|
International Futures Research |
There is an excellent chance that a large Symmetrical Triangle is forming on the daily June S&P 500 futures chart. Friday's high at 1165.00 (set in GLOBLEX electronic dealing) would be reversal point four (and last) point in the formation. For the line drawn across the 1165.00 high to be a valid line, a lower daily high than 1165 must be set on Monday April 9.
Any Symmetrical Triangle tends to be a continuation pattern with 75% probability. Therefore, the high probability direction for the breakout will be to the downside.
The vertical height of the Triangle (as measured vertically at reversal point two) is 104 points. A downside breakout, with a close below the lower boundary line would be expected to go another 104 points down from the breakout level.
The lower boundary line of the Triangle on the June S&P future crosses at a price level of 1104.00 on Monday April 9. The line slopes upward at a rate of 2.5 full price points per trading session. If a Triangle officially forms, and is activated, the downside measuring objective will be in the 1000 area.
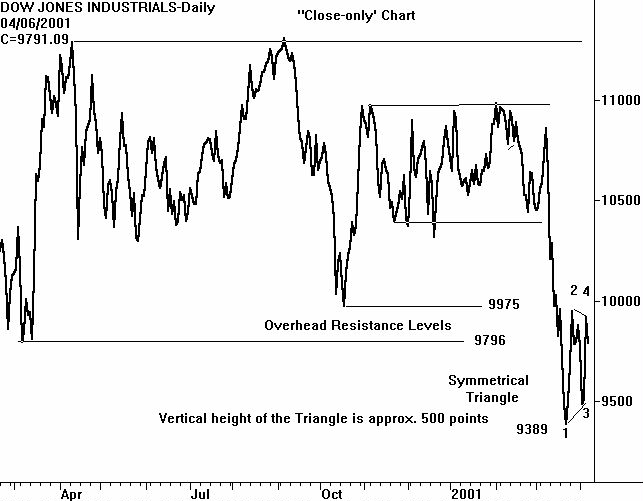
The daily cash Dow chart contains a Symmetrical Triangle.
CHARTWATCH has shown this chart a close-only' price plot. Depicting the Dow
using this style shows why the price rally has halted where it has. Overhead resistance
from two low closes at 9796 and 9975 would be expected to contain any rally in a bear
market. They have. And note that Friday's close in the Dow was 9791.09. Monday will
be an important day, technically.
The vertical height of the Triangle on the close-only chart is approximately 500 points. A downside breakout would occur on a close below 9500. This will create a downside measuring objective in the 9000 area. Using the extremes of the daily price bars creates a Triangle with an objective that is definitely below 9000.
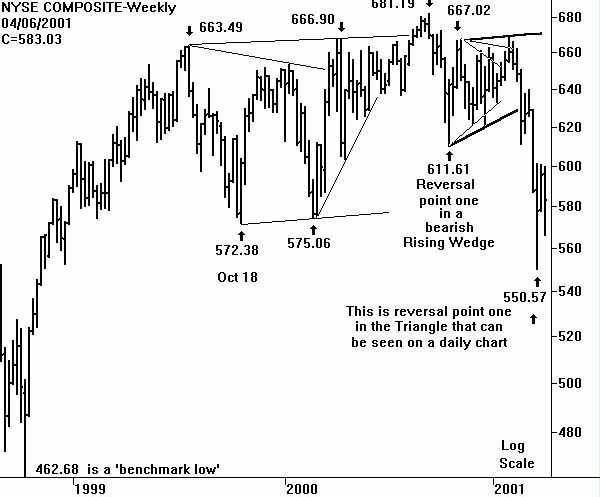
The daily chart of the NYSE Composite (not shown) is in the same bar charting condition as the S&P 500. A Symmetrical Triangle is trying to form. The weekly chart of the NYSE Composite is included here to show that no underlying support is present. If a move below the lower boundary line on the Triangle occurs - there are no former price lows' to stop the decline.
Before getting too carried away with the bearish possibilities of the Triangles, remember that a move above what CHARTWATCH is construing as reversal point four in the Triangle would not automatically be bullish. It would disrupt the maximum amount of bears and then probably lead to another reversal (point 4) in a bearish Rising Wedge. The price action on Monday April 9 will be very important in strengthening or weakening the triangle scenario.
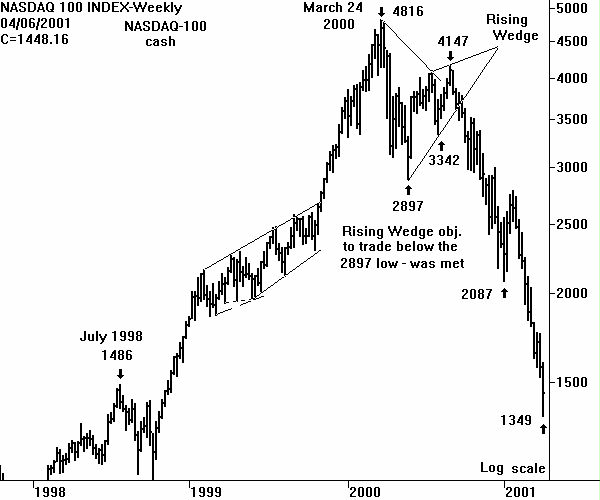
The cash NASDAQ-100 chart is different from the other three index charts because the severe weakness did not create the price reversals necessary to form a Triangle. The chart included this week is a weekly chart. It shows that the NASDAQ-100 did bounce' from support at the July 1998 high of 1486. But the low of the selloff, at 1349 in the cash NASDAQ-100, far into the support, is certainly not producing any confidence that this support will be able to hold.
Not shown is what the open interest in both of the NASDAQ-100 futures on the price rally on Thursday April 5. They declined. Minus 6,129 in the eMini and minus 155 contracts in the big' contract. It certainly appears that the speculative public finally figured out how to short the market - and it led to a rally brought about by their short covering.
A look at the monthly NASDAQ-100 chart will show that the July 1998 high at 1486 is not very impressive support. Given the bearish potential for the Triangles on the other three indexes, there is nothing on the NASDAQ-100 chart to imply that a tradable price bottom is in place.
In similar technical situations where price was in a Symmetrical Triangle, CHARTWATCH has recommend vertical bear spreads using put options. A higher strike put will be purchased and a lower strike put sold. This is a debit spread that has follow-up capability. A downside b reakout of the Triangle would prompt the lifting of one-half of the lower strike sold. A pullback to the Triangle allows the remaining one-half of the lower strike puts to be covered. The resulting position is simply long puts - the most bearish option strategy.
The downside breakout from the Triangles would be expected to occur before the expiration of the April options (check the exact expiration for the index in question).

Monthly S& P 500, NASDAQ-100 and Dow Charts
Yearly Dow Jones Industrial Chart
Selected S&P Futures Implied Volatility Charts (March 6, 2001)
Return to Sample Research Reports
| Home | Weekly Research Reports | Audio Market Update | Technical Analysis Video Tapes | Technical Analysis Books | Technical Analysis Courses |