|
International Futures Research |
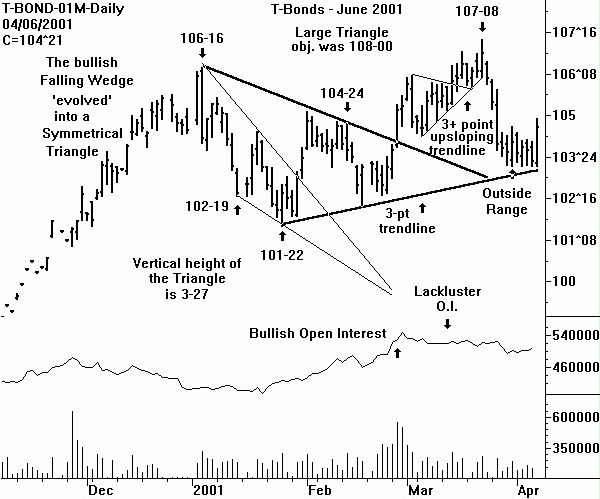
Recall that an Outside Range Day (O/R) was posted on the June T-Bond chart on Friday March 30. The bar charting implication was that a higher price high (than the O/R high) above 104-21 should be set. It took all week, but finally on Friday this objective was satisfied.
It appears that a case for a bullish position is present. Yes. But only for the nimble traders. A look at the weekly continuation chart (click below) shows an ominous technical condition:
1. Five waves up from the January 2000 low are present. An Elliott Wave conclusion is that a downward correction (composed of three waves) should now occur.
2. The extension of the lower boundary line of the Symmetrical Triangle (on both the weekly and daily charts) is now a three point trendline. Taking out 103-16 to the downside would violate an important trendline.
3. An interesting trendline' has been constructed on the plot of the 9-week RSI. Although CHARTWATCH is reluctant to do any price pattern recognition on an RSI, the fact is clear that the series of higher and higher RSI price postings has been disrupted. If this were a price chart, the conclusion would be that the uptrend has stopped.
Recall from last week's research, that a Key Reversal Month is present at a high on the monthly chart (click below). This continues to imply that a lower monthly low (than 103-16) should be posted.
The technical conclusion from last week remains valid: The T-Bonds will try to rally to above 104-21 (done), and then decline to below 103-16.
Technical traders should be watching for another of the four classic minor trend change indicators. For example, on Monday, a higher high (than 104-28) with a lower close (below 104-21) would be a Reversal Day - and prompt a new short sale.
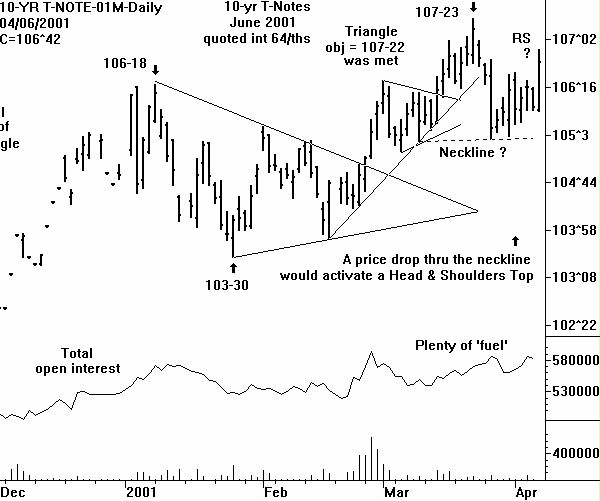
CHARTWATCH believes the move below 103-16 will be a shocker' to the fundamental traders. This is the price move to try to catch. Note that a price drop below 105-30 on the June 10-yr T-Note would constitute a downside breakout from a Head & Shoulders Top.
Weekly and Monthly T-Bond Charts
Monthly chart updated only once a month
Selected T-Bond Futures Volatility Charts (Thru March 6, 2001)
Return to Sample Research Reports
| Home | Weekly Research Reports | Audio Market Update | Technical Analysis Video Tapes | Technical Analysis Books | Technical Analysis Courses |