
|
International Futures Research |
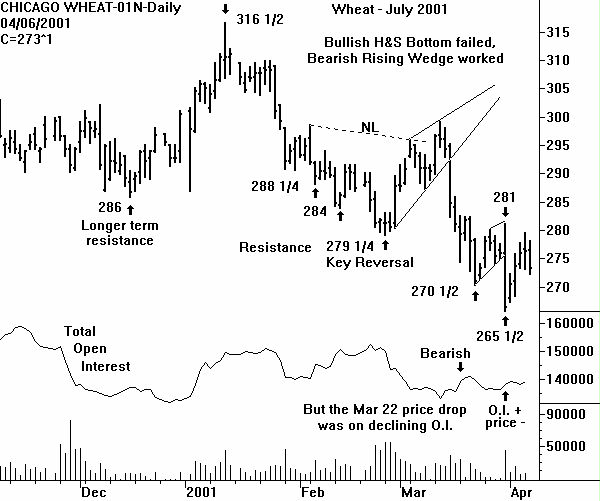
The ability of the July Wheat to trade above resistance at 270 1/2 was the first bar charting sign of price strength. Now the July Wheat is encountering much more substantial overhead resistance at 279 1/4. This is because the 279 1/4 resistance is quite obvious on a weekly chart of the July Wheat (not shown). CHARTWATCH will use the 280 level, basis the July Wheat, as the pivotal price point.
Below 280, Wheat is still in a long term bottoming mode with the short term bears in control. July Wheat above 280 means the bears have been neutralized and the bulls are working on the multi-year price bottom.
Additional resistance is present on the July Wheat from a relative price low in September of 2000 at 283 1/2. This resistance cannot be seen on the daily chart because the data shown begins in mid-November.
The ideal bottoming condition for a bar chartist would occur if several low volume (20,000-) price down days are posted on the daily chart. This could form the right shoulder of a small Head & Shoulders Bottom. This may have started on Friday with the three cent price dip.
Also ideal for the bulls would be the failure of open interest to expand on any price down days. Note that the big price drop on Friday March 30 occurred on increasing open interest (+1,650 contracts). The lackluster open interest on the small price rally since then is telling traders not to chase the price rally. This is why the knowledge of where overhead resistance is located is so important. Any short covering rally would be expected to stop at the resistance.
CHARTWATCH will stay on the sidelines in Wheat, watching the price action in the July future with respect to the resistance at 279 1/4 and 283 1/2. If the end of week price pressure is creating a right shoulder, there will be plenty of time to get aboard a bull move.
Weekly and Monthly Wheat Charts
Implied Volatilty Charts (Thru March 6, 2001)
Seasonal Volume and Open Interest and Commitments Graphs
Return to Sample Research Reports
| Home | Weekly Research Reports | Audio Market Update | Technical Analysis Video Tapes | Technical Analysis Books | Technical Analysis Courses |